
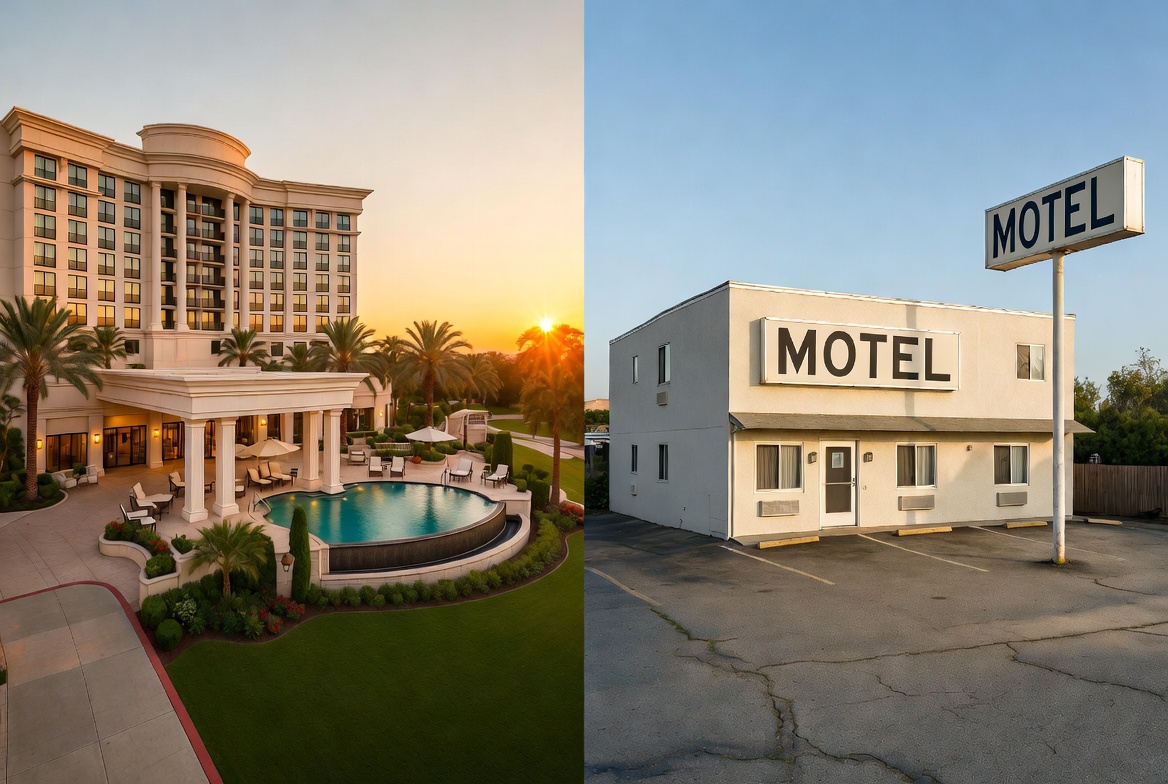
The Barbell and the Broker: Hotel Brokerage in 2026 and the Discipline of Selective Opportunity

By Nathan Snyder
July 9, 2026
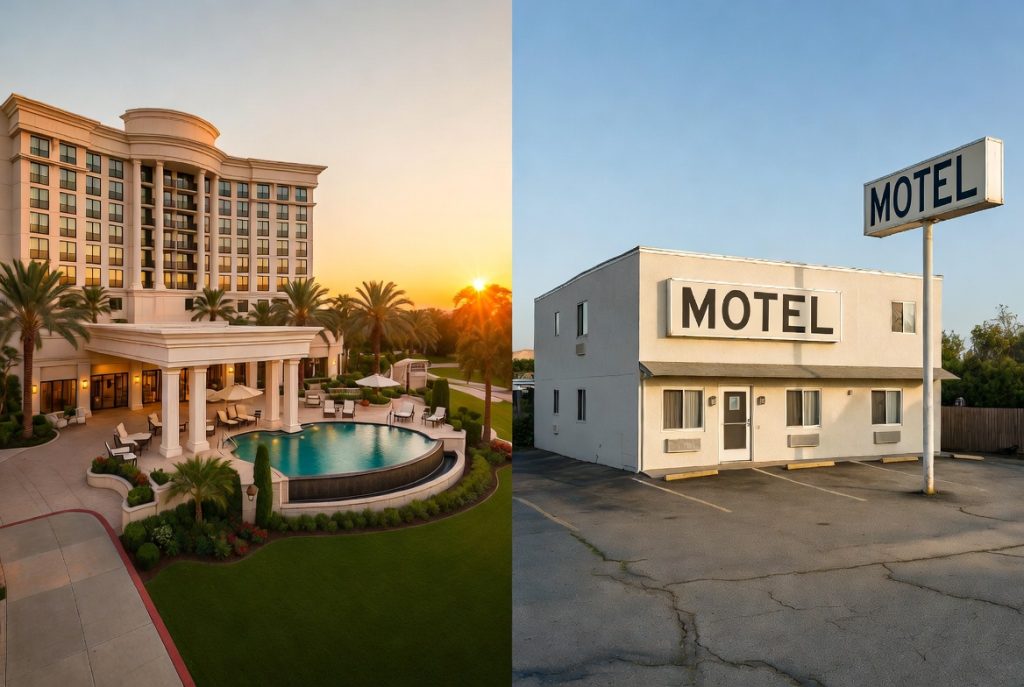
In the echoing corridors of the U.S. hospitality investment market, 2026 does not announce itself with the brass band of a broad-based recovery. It arrives instead as a study in divergence—a market that has, with some reluctance, accepted its own split personality. On one side stand the trophy and luxury assets, trading with the quiet confidence of blue-chip securities and often clearing well above $1 million per key in gateway locations. On the other lies the expansive middle and lower tier, where days-on-market stretch toward double digits and pricing reflects a more sobering calculus of risk and renovation need.
This is not merely a cyclical story. It is the logical endpoint of post-pandemic repricing, elevated interest rates that only recently began easing, a wall of maturing debt, and a consumer landscape that has itself bifurcated along income lines. For hotel brokers—those who must translate these macro forces into actionable inventory and credible buyer matches—the year demands a sharper diagnostic eye and a narrower specialization than many have practiced before. The data, drawn from the leading research houses, paints a picture of rebounding volume that is real yet highly selective, and of cap-rate dynamics that reward precision over optimism.
Transaction Volumes Rebound—But Gravity Remains Uneven
Global hotel investment volumes rose 22 percent in 2025 from the 2023 trough, according to JLL’s Global Hotel Investment Outlook 2026, with the Americas posting the strongest regional gain at 27 percent (JLL Hotels & Hospitality Group, 2026). In the United States, transaction activity accelerated meaningfully; Cushman & Wakefield reported nearly $9.4 billion in hotel sales volume for the first quarter of 2026 alone, representing a 64 percent year-over-year increase, with limited-service assets nearly doubling in activity (Cushman & Wakefield, 2026). Early-year momentum appears consistent with the roughly $24 billion full-year 2025 U.S. figure referenced in contemporaneous reporting.
Yet these headline gains mask important qualifiers. Colliers’ 2026 U.S. Hospitality Outlook projects lodging demand growth of only 1.3 percent in the top 50 markets and ADR growth of 1.35 percent—well below long-term averages—while noting that 90 percent of consumers now cite “value for money” as their primary travel decision factor (Colliers, 2026). Matthews & Company’s 2026 Hospitality Outlook similarly cautions that the post-pandemic recovery phase has concluded and that a wave of supply hitting the market—potentially 5 percent of U.S. inventory or nearly 5,850 additional listings—could exert further downward pressure on values, particularly as over-levered owners confront refinancing realities (Matthews, 2025). The rebound, in short, is volume-driven and increasingly distress-tinged rather than a uniform celebration of operational strength.
The Great Bifurcation: Luxury’s Quiet Strength and the Economy’s Longer Shadow
The single most defining characteristic of the 2026 brokerage environment is the persistence—and in some analyses, acceleration—of performance and valuation divergence between chain scales. PwC’s Emerging Trends in Real Estate framework, carried forward into 2025–2026 observations, highlighted this premiumization gap as a central theme; subsequent data has borne it out. Through August 2025, STR figures cited by PwC showed luxury hotels posting 5.3 percent year-to-date RevPAR growth while the economy segment recorded a 1.8 percent decline—the only two chain scales in positive territory being luxury and upper-upscale (PwC, 2025).
HVS data on closed transactions reinforces the pricing consequences: overall average cap rates hovered around 8.2–8.3 percent in late 2025 and early 2026, with stabilized or near-stabilized assets clustering in the 8.0–8.5 percent range (HVS, 2026). Luxury and extended-stay properties often clear below that band, while older limited- and full-service assets requiring significant capital expenditure trade at wider spreads. MMCG analysis of CoStar data places upscale and upper-midscale cap rates near 9.5 percent in 2025, with luxury nearer 8 percent and economy above 10.5 percent—levels that represent a roughly 100–150 basis point expansion from pre-pandemic norms for many segments (MMCG, 2025). National average price per room sits near the $117,000 mark cited in earlier commentary, yet the dispersion is extreme: economy assets frequently transact below $50,000 per key while flagship luxury properties in core markets exceed $2 million.
This barbell is not expected to collapse soon. HVS anticipates modest downward pressure on blended cap rates in 2026 precisely because more challenged, turnaround assets will enter the transaction pool, pulling averages lower even as high-quality stabilized product continues to command tighter yields (HVS, 2026). For brokers, the implication is structural: deep specialization in either the upper or lower half of the spectrum—or both, with distinct teams and buyer networks—has become a competitive necessity rather than a stylistic choice.

Debt Dynamics, Cap Rates, and the Refinancing Shadow
Elevated interest rates through 2023–2025 pushed hotel cap rates higher across the board; the subsequent moderation in rates has begun to stabilize and, in select cases, modestly compress yields for the best assets. CBRE’s cap rate survey work and broader market forecasts signal early signs that investors view yields as having passed their peak, with improving liquidity and firmer pricing emerging (CBRE, 2026). Yet lender selectivity remains pronounced. Properties with clear operating histories, credible turnaround plans, and strong sponsorship close; those lacking either often linger.
The debt maturity calendar adds urgency. While the absolute peak of the “wall” may have crested, 2026 still features substantial CMBS hard maturities—estimated near $76.6 billion nationally—alongside broader commercial mortgage maturities in the hundreds of billions (Trepp, 2026; Mortgage Bankers Association data referenced in Reed Smith analyses, 2026). Many of these loans were originated in a lower-rate environment; refinancing or sale decisions will force price discovery for assets that have not yet fully adjusted to today’s cost of capital. Crittenden reporting from mid-2026 notes that private investors drove the majority of 2025 hotel transaction volume, with institutional capital more measured, underscoring that the most active buyers are often those with dry powder and flexible mandates rather than highly leveraged structures (Crittenden Report, 2026).
In this environment, the broker’s role expands beyond matching to include sophisticated capital markets navigation—understanding which lenders remain active in hospitality, which sponsors have the capacity to recapitalize, and which assets are better repositioned through sale than prolonged ownership.
Adaptive Reuse, Conversions, and the Economics of Reinvention
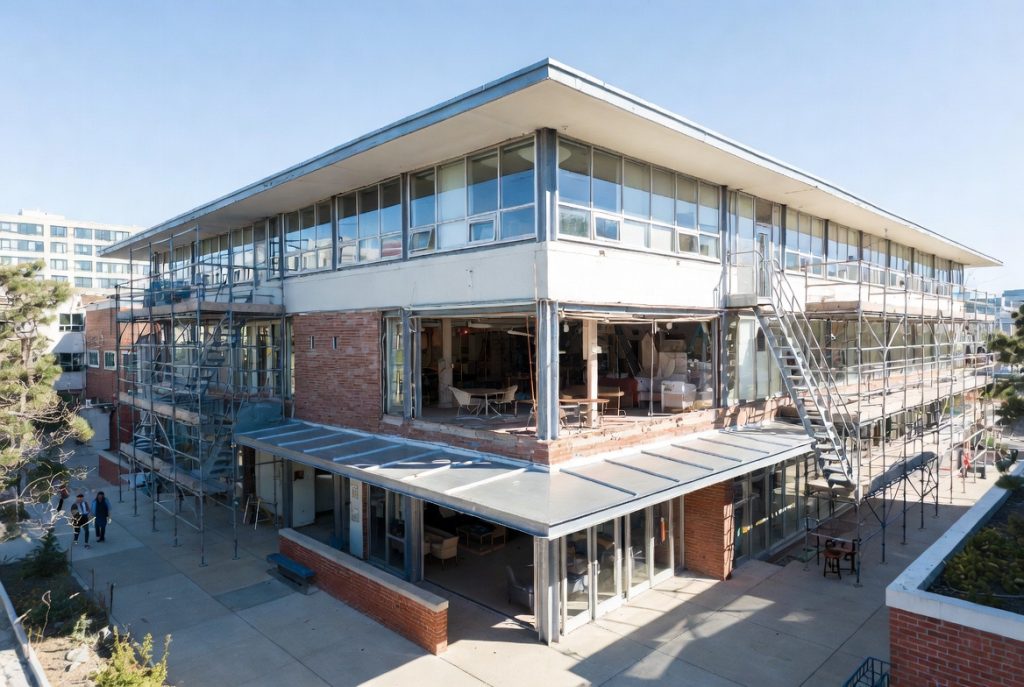
With new construction economics constrained by elevated costs and cautious debt markets, brokerage activity has gravitated toward conversions and adaptive reuse. Office-to-hotel, retail-to-hotel, and underperforming hotel-to-rebranded or independent conversions have become fertile ground, particularly where food-and-beverage revenue can represent a significantly larger share of total income—approaching 50 percent in some repositioned assets, as noted in earlier market commentary. These plays appeal to operators seeking lower basis and to investors attracted to value-add upside with more controllable execution risk than ground-up development.
Colliers and other observers note that construction pipelines have moderated, which should provide a supportive backdrop for existing and converted inventory over the medium term (Colliers, 2026). Brokers who maintain strong relationships with developers, architects, and brand teams specializing in conversion work are positioned to capture this niche, which often requires longer marketing cycles but can deliver attractive risk-adjusted returns for the right buyer.
Event-Driven Catalysts and the Broader Travel Backdrop
Major events continue to function as short- and medium-term demand accelerants. The 2026 FIFA World Cup, hosted across North American markets, has already begun to focus investor attention on host cities and spillover destinations for assets that can capture elevated cash flows during the tournament window and beyond. While specific transaction data tied solely to the event remains emerging, the broader principle—documented across multiple cycles—is that well-located inventory in event markets can support premium hold periods or accelerated exits.
More fundamentally, global travel demand has shown resilience. JLL notes that international tourist arrivals surpassed pre-pandemic levels in 2025, with air passenger volumes expected to grow further in 2026 (JLL Hotels & Hospitality Group, 2026). WTTC and UN Tourism-aligned reporting reinforces that the sector’s contribution to global GDP remains robust, even amid pockets of economic caution. Yet this aggregate strength coexists with the segment-level bifurcation already discussed: luxury and experiential travel continue to draw high-net-worth and international demand, while middle-market and economy segments face greater price sensitivity and competition from alternative lodging.
The Broker’s Imperative: Specialization, Data, and Relationship Architecture
In a market this differentiated, the successful brokerage practice in 2026 will likely exhibit several non-negotiable traits. First, deep specialization—either in luxury/trophy assets with institutional and family-office buyers or in value-add and distressed opportunities with opportunistic capital—outperforms generalism. The data demands credible 3- to 5-year performance forecasts; buyers are no longer content with historical averages when underwriting assumptions must incorporate segment-specific RevPAR trajectories and capex realities.
Second, data fluency has moved from advantage to table stakes. Access to STR, CoStar, and proprietary performance modeling allows brokers to position inventory accurately and to counsel sellers on realistic pricing and marketing timelines. Third, relationship architecture across private equity, family offices, sovereign and institutional platforms, and international capital remains the ultimate moat. The most active buyers in recent periods have been private investors; those with repeatable access to such capital will capture disproportionate flow.
Finally, the best practitioners are increasingly acting as strategic advisors rather than pure transactional agents—helping owners decide whether to sell, recapitalize, or reposition, and guiding buyers toward assets whose operational realities align with their return profiles and risk tolerance. In a bifurcated market, that advisory layer is where enduring value is created.
Outlook: Selective Opportunity, Not Uniform Revival
The 2026 hotel brokerage landscape rewards those who read the barbell correctly and position accordingly. Transaction volumes are recovering, debt markets are thawing selectively, and major events plus moderating supply growth provide tailwinds for well-placed assets. Yet the performance gap between luxury and the rest of the field shows little sign of closing quickly, cap rates remain elevated relative to the past decade for most segments, and a meaningful portion of inventory will continue to face marketing and pricing headwinds.
Brokers who treat this environment as a diagnostic and matchmaking discipline—matching the right capital to the right asset’s specific story—will find 2026 a year of meaningful production. Those waiting for a tide that lifts all boats may find the water receding around their listings. The market has made its choice clear: opportunity exists, but it is concentrated, and it must be earned through precision, relationships, and an unflinching view of the data.
References
Colliers. (2026). U.S. Hospitality Outlook Report | 2026. https://www.colliers.com/en/research/nrep-ushsp-hospitality-outlook-report-2026
Crittenden Report. (2026, May 12). Multiple factors are shaping the outlook for hotel real estate in 2026. Crittenden Report. https://crittendenreport.com/multiple-factors-are-shaping-the-outlook-for-hotel-real-estate-in-2026/
Cushman & Wakefield. (2026). U.S. Hospitality MarketBeat. https://www.cushmanwakefield.com/en/united-states/insights/us-marketbeats/hospitality-marketbeat
Deloitte. (2025). 2026 commercial real estate outlook. https://www.deloitte.com/us/en/insights/industry/financial-services/commercial-real-estate-outlook.html
HVS. (2026, April 30). U.S. Market Pulse: April 2026. https://www.hvs.com/article/10450-hvs-us-market-pulse-april-2026
JLL Hotels & Hospitality Group. (2026). Global hotel investment outlook 2026. https://www.jll.com/en-us/insights/market-outlook/global-hotel-investment
Matthews. (2025). 2026 Hospitality Outlook. https://www.matthews.com/insights/2026-hospitality-outlook
MMCG. (2025, August 30). U.S. hotel cap rates in 2025: Trends, drivers, and segment analysis. MMCG Invest. https://www.mmcginvest.com/post/u-s-hotel-cap-rates-in-2025-trends-drivers-and-segment-analysis
Mordor Intelligence. (2026). Hospitality real estate market size, growth trends & industry analysis. https://www.mordorintelligence.com/industry-reports/hospitality-real-estate-sector
PwC. (2025). Hospitality industry outlook. In Emerging Trends in Real Estate®. https://www.pwc.com/us/en/industries/financial-services/asset-wealth-management/real-estate/emerging-trends-in-real-estate-pwc-uli/property-type-outlook/hospitality.html
Real Capital Analytics / MSCI (data cited in HVS reporting). Various transaction and cap rate analyses, 2025–2026.
Trepp. (2026). CMBS hard maturity playbook: 2024–2025 lessons & 2026 outlook. https://www.trepp.com/trepptalk/cmbs-hard-maturity-playbook
Additional supporting data drawn from CBRE cap rate surveys and capital markets forecasts (2026), Mortgage Bankers Association commercial/multifamily maturity projections, and cross-referenced industry reporting on transaction volumes and performance metrics. All sources cross-verified for consistency with primary market observations as of mid-2026.
This article was prepared for Hotelier Times with rigorous attention to primary industry research and aims to provide brokers, owners, and investors with a clear-eyed, evidence-based perspective on the year ahead.